Africa Crop Production Model - Methodology Overview
The Africa Crop Production (AfCP) model provides forecasts on food crop production for several crops and countries across the African continent. Its spatial resolution is at the community level with a grid cell size of 10 by 10 kilometers. The estimations are based on a combination of three components: i. remotely sensed biophysical parameters retrieved from satellite images, ii. historical production maps, and iii. machine learning techniques.
AfCP Model Inputs
- The Normalized Difference Vegetation Index (NDVI)
- Daytime Land Surface Temperature (LST)
- Rainfall Data
- Evapotranspiration
- Crop Masks
- Crop Calendar
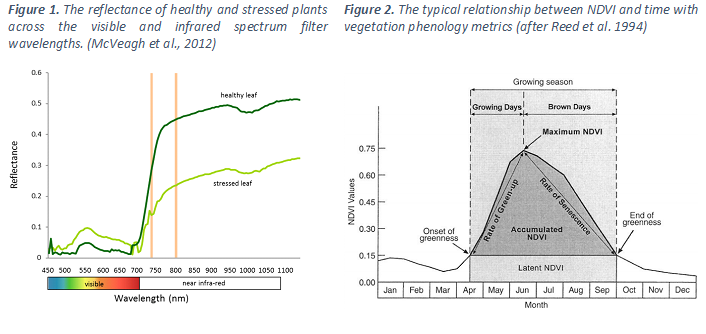
The construction of the Africa Crop Production (AfCP) model requires explanatory variables to assess crop conditions through the growing season. The first variable used is the Normalized Difference Vegetation Index (NDVI), which is the ratio between the difference of near-infrared (NIR: 0.7 – 1.1µm) and red (R: 0.6 – 0.7µm) bands of multispectral images reflectance, and their sum. The rationale of using the NDVI as the first input into the AFCPM is justified first, by its close relationship with crop yield (Huang and Han, 2014; Liu et al., 2019; Rembold et al., 2013), and second, by its capacity to assess the photosynthesis activity intensity of crops’ leaves as a proxy to their health (McVeagh et al., 2012).
Crop leaves absorb specific wavelengths of the electromagnetic spectrum and reflect the remaining ones, as shown in figure 1. Among the reflected wavelengths are the green-to-yellow and NIR bands, while the others are absorbed. Leaf pigments use the absorbed wavelengths as energy for photosynthesis. The underlying foundation of the NDVI is that the more crop leaves reflect NIR and absorb a part of the visible wavelengths, the more they have the energy for photosynthesis, then produce biomass, and, ultimately, generate the crop outputs. Since the NDVI is a normalized ratio between NIR and R bands, its values range from -1.0 to +1.0, with the vegetation NDVI values being somewhere between +0.1 and +1.0 (cf. figure 2).
The MODIS NDVI version 6 product (Didan, 2015) at one-kilometer spatial resolution is used for the AfCP model. The product consists of twelve scientific datasets (SDS), with the first layer being the NDVI. The NDVI layer is a raster map available every 16 days from 2000 up to now. Each pixel contains the NDVI value of the corresponding area and fluctuates between -0.2 and +1.0. The twelfth layer of the MODIS NDVI product contains information about the NDVI pixel reliability ranging from 0 to 3: 0 corresponds to good data, and 3 corresponds to cloudy scenes. Only NDVI pixels with reliability values of 0 and 1 have been retained, while the others are not considered.
Several studies have shown that final crop yields are also related to thermal indices (Leroux et al., 2016). We used the MODIS/Terra land surface temperature version 6 product (Wan et al., 2015) at one-kilometer spatial resolution. The product consists of twelve scientific datasets. More specifically, we used the first layer that corresponds to the daytime land surface temperature with pixel values ranging from 150 to 1310.7 degrees Kelvin. Like the NDVI, the quality assurance layer has been used to select reliable daytime land surface temperature pixels.
Another reason for the LST to be used as a second input into our model is to consider a parameter sensitive to temperature spikes due to climate change. The MODIS/Terra daytime land surface temperature provides a time-series from 2000 up to now, hence allows trend analysis and adding them into the dataset patterns that the AfCP model learns.
The third input variable of the AfCP model is rainfall data. Water availability is an essential parameter for crop growth. There are two ways of dispensing water in agriculture: irrigation and rainfall—however, some statistics approximate rainfed agriculture to account for 95% of farmlands in sub-Saharan Africa. Hence, we consider the monthly Climate Hazards InfraRed Precipitations with Stations (CHIRPS) dataset (Funk et al., 2015) for the African continent with a 0.05-degree grid cell size. The dataset is available from 1981 up to now.
The fourth input parameter to the AfCP model is the evapotranspiration (ET) data. The underground water is conveyed towards the atmosphere with two main channels: Evaporation and Transpiration from a plant perspective. The former corresponds to the transformation of liquid water bodies into their gaseous state and their release into the atmosphere. For the Evaporation process to occurs, enough soil moisture, vapor pressure gradient, and a significant amount of energy (600 calories of heat energy for 1g of water) are required. The transpiration mechanism consists of underground water transportation from the soil to the plants’ roots and from the plants’ roots to the leaves. Such water transportation occurs through the vascular plant tissues, and a portion of it reaches the leaves before evaporating into the atmosphere. The knowledge of crops’ evapotranspiration rate is considered as a proxy to assess crops’ water stress. However, measuring the two processes’ contribution in the amount of water vapor surrounding the crop is difficult for large areas; therefore, their combined effects are usually measured with the evapotranspiration indicator from remote sensing products. We use the total ET layer of the MODIS/Terra Net Evapotranspiration product for the AfCP model.
| Table 1. The AfCP model remote sensing input variables with their spatial and temporal characteristics | ||||
| Input Parameters | Identification Number | Spatial resolution (km) | Temporal Resolution (days) | Temporal extent (period) |
| NDVI | MOD13A2 | 1 | 16 | 2000 - now |
| LST-day | MOD11A2 | 1 | 8 | 2000 - now |
| Rainfall | Africa_monthly | 5.55 | 30 | 1981 – Dec 20201 |
| Evapotranspiration | MOD16A2 | 0.5 | 8 | 2000 - now |
| Production | P | 10 | - | 2000, 2005, 2010, 2017 |
A key aspect of the AfCP model methodology is crop masks that allow us to identify where specific crops are being grown on the ground and at a pixel level. There is no crop mask for major crops in Africa available in the literature from our best knowledge. For the AfCP model, we generate our crop masks by transforming historical crop production maps provided by the Spatial Production Allocation Model (SPAM) (IFPRI, 2016, 2019, 2020). The SPAM production maps pixels contain production quantities of a selected crop. Each pixel with a production value can be considered as an area where the crop is believed to be grown. We replace production values with unity and zero everywhere else. The resulting map can be considered as a filter. When the latter is convoluted with another map with the same grid cell size, only pixels values of the second map at the area of production will be retained2 .
Since crops are not grown simultaneously across the African continent, there is a need to adapt the input variables. For each crop selected for a country on the AfCP model, the crop calendar (FAO, 2021) is consulted. The input variables’ maps that lay within the growing season are used to compute an arithmetic average for each pixel. The corresponding values are used as the final inputs to the model. However, to provide production forecasts before the harvesting period, historical values of input variables are used in a random forest model to predict their values for the forthcoming season.
Africa Crop Production (AfCP) Model - Machine Learning Framework
The AfCP model is built using the machine learning artificial neural network (ANNs) technique. The ANNs are a supervised learning technique that requires explanatory variables as inputs and labels or examples as corresponding outputs. The model’s construction corresponds to learning the relationship between the inputs and the labels through an iterative process.
The input maps mentioned above (cf. section 1) are explanatory variables, and the SPAM production maps are the labels. The years 2005, 2010, and 2017 are considered since their production values are available and are the most recent ones.
AfCP Model Outputs
After the pre-processing of input variables and the training process with an artificial neural network, the AfCP model provides a map of production values for a selected crop at a 10 x 10-kilometer grid cell size. Each pixel contains the crop’s production quantity for the following agricultural season based on the learned relationship between previously observed explanatory variables and production quantities.
Jing Huang & Dawei Han (2014) Meta-analysis of influential factors on crop yield estimation by remote sensing, International Journal of Remote Sensing, 35:6, 2267-2295
Liu, J.; Shang, J.; Qian, B.; Huffman, T.; Zhang, Y.; Dong, T.; Jing, Q.; Martin, T. Crop Yield Estimation Using Time-Series MODIS Data and the Effects of Cropland Masks in Ontario, Canada. Remote Sens. 2019, 11, 2419. https://doi.org/10.3390/rs11202419
Rembold, F.; Atzberger, C.; Savin, I.; Rojas, O. Correction: Rembold, F.; Atzberger, C.; Savin, I.; Rojas, O. Using Low Resolution Satellite Imagery for Yield Prediction and Yield Anomaly Detection. Remote Sens. 2013, 5, 1704-1733. Remote Sens. 2013, 5, 5572-5573. https://doi.org/10.3390/rs5115572
McVeagh, Philippa & Yule, Ian & Grafton, Miles. (2012). PASTURE YIELD MAPPING FROM YOUR GROUNDSPREAD TRUCK.
Reed, B.C., Brown, J.F., VanderZee, D., Loveland, T.R., Merchant, J.W. and Ohlen, D.O. (1994), Measuring phenological variability from satellite imagery. Journal of Vegetation Science, 5: 703-714. https://doi.org/10.2307/3235884
Didan, K. (2015). MOD13A2 MODIS/Terra Vegetation Indices 16-Day L3 Global 1km SIN Grid V006 [Data set]. NASA EOSDIS Land Processes DAAC. Accessed 2021-02-14 from https://doi.org/10.5067/MODIS/MOD13A2.006
Leroux, Louise & Baron, Christian & Zoungrana, Bernardin & Traore, Seydou & Lo Seen, D. & Bégué, Agnès. (2016). Crop Monitoring Using Vegetation and Thermal Indices for Yield Estimates: Case Study of a Rainfed Cereal in Semi-Arid West Africa. IEEE Journal of Selected Topics in Applied Earth Observations and Remote Sensing. 9. 347-362. 10.1109/JSTARS.2015.2501343.
Wan, Z., Hook, S., Hulley, G. (2015). MOD11A2 MODIS/Terra Land Surface Temperature/Emissivity 8-Day L3 Global 1km SIN Grid V006 [Data set]. NASA EOSDIS Land Processes DAAC. Accessed 2021-02-14 from https://doi.org/10.5067/MODIS/MOD11A2.006
Funk, C., Peterson, P., Landsfeld, M. et al. The climate hazards infrared precipitation with stations—a new environmental record for monitoring extremes. Sci Data 2, 150066 (2015). https://doi.org/10.1038/sdata.2015.66
Running, S., Mu, Q., Zhao, M. (2017). MOD16A2 MODIS/Terra Net Evapotranspiration 8-Day L4 Global 500m SIN Grid V006 [Data set]. NASA EOSDIS Land Processes DAAC. Accessed 2021-02-20 from. https://doi.org/10.5067/MODIS/MOD16A2.006
International Food Policy Research Institute (IFPRI); International Institute for Applied Systems Analysis (IIASA), 2016, “Global Spatially-Disaggregated Crop Production Statistics Data for 2005 Version 3.2”, https://doi.org/10.7910/DVN/DHXBJX, Harvard Dataverse, V9
International Food Policy Research Institute, 2019, “Global Spatially-Disaggregated Crop Production Statistics Data for 2010 Version 2.0”, https://doi.org/10.7910/DVN/PRFF8V, Harvard Dataverse, V4
International Food Policy Research Institute, 2020, “Spatially-Disaggregated Crop Production Statistics Data in Africa South of the Sahara for 2017”, https://doi.org/10.7910/DVN/FSSKBW, Harvard Dataverse, V3
United Nations Food and Agriculture Organization. (2021). GIEWS - Global Information and Early Warning System – Country Briefs. http://www.fao.org/giews/country-analysis/country-briefs/index.jsp
2 For 2020, the 2017 generated crop mask was considered.